Ever run your website through Google’s PageSpeed Insights or Lighthouse, only to feel confused or frustrated by the results? You’re not alone. While these tools give you scores and advice to “improve your site,” nearly every important result is labeled with jargon: First Contentful Paint (FCP), Cumulative Layout Shift (CLS), Total Blocking Time (TBT)... Most website owners need simple answers, not technical language!
Here’s what Google (and other tools) should say, in everyday words:
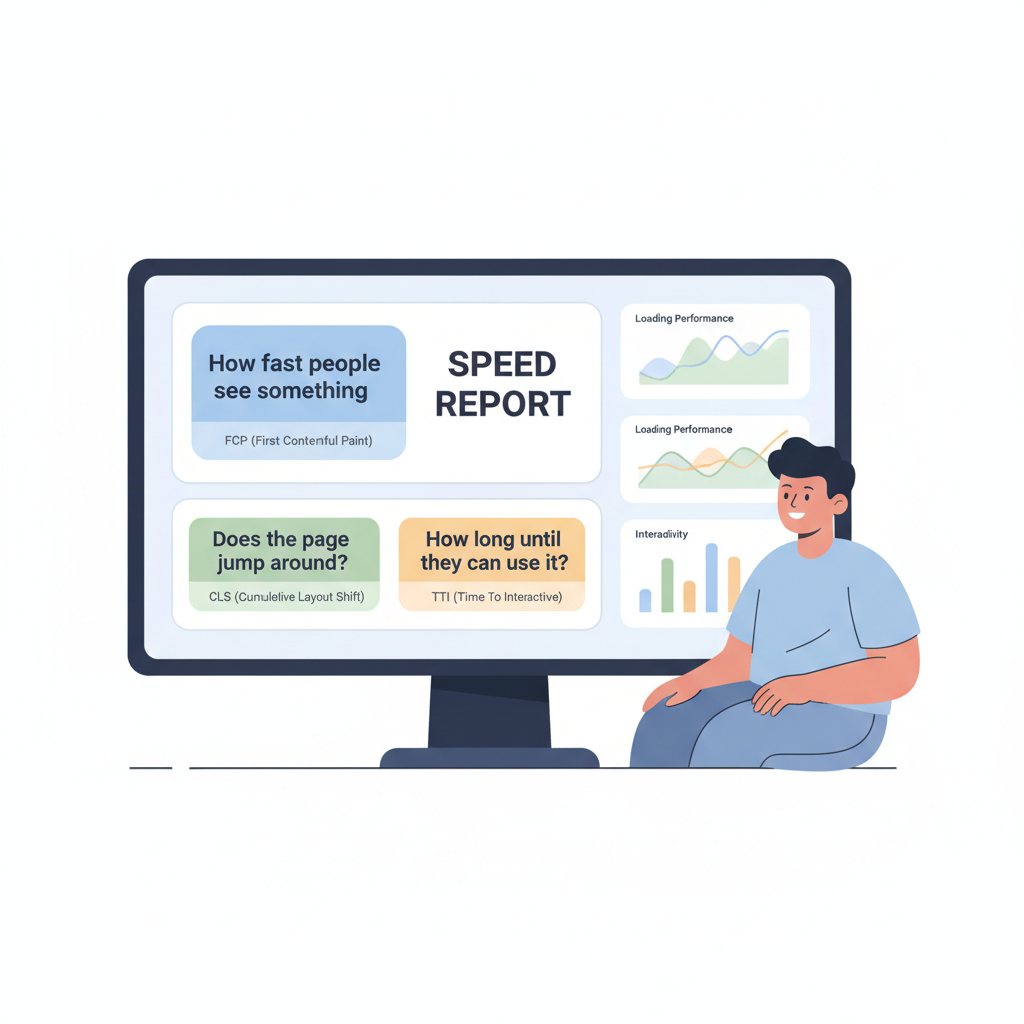
- How soon do people see something appear = First Contentful Paint, FCP
- Does the page jump around while loading = Cumulative Layout Shift, CLS)
- How long until people can really use your site Time to Interactive, TTI)
- Is your site easy for everyone (even with disabilities) = Accessibility Score
- How well do you show up in search = SEO Score
Jargon vs. Everyday Language: Results Labels That Make Sense
Beyond the main performance metrics, PageSpeed Insights and Lighthouse use even more technical labels for results. Here’s how they could, and should, be translated for real-world users:
| Technical Label | Plain, Natural Language (6th Grade English) |
|---|---|
| Performance Grade | How well your site is performing overall |
| Core Web Vitals | Key things that make your site fast and smooth for visitors |
| Poor (under Core Web Vitals) | These important things are not working well |
| Avg Performance Score | The average “how well” score for your site |
| Avg Load Time | How long it takes your site to load (on average) |
| Analysis Time | When the test was done |
| Processing Time / N/A | How long the test took (not available here) |
| Analysis Successful | Did everything work for the test? (Yes or No) |
| Mobile Metrics | Test result for phones and tablets |
| Load Time | How long it takes the page to fully show up |
| Accessibility Score | How easy is it for everyone (even with disabilities) to use? |
| Best Practices Score | Does your site follow the best guidance for safety and design? |
| SEO Score | How well your site appears in search results |
| LCP (Largest Contentful Paint) | How soon people see the main part appear |
| FID (First Input Delay) | How quickly things respond when someone tries to interact |
| CLS (Cumulative Layout Shift) | Does anything move around unexpectedly as the page loads? |
| Speed Index | How fast most of your content appears overall |
| TTI (Time to Interactive) | How long until the page is ready to use |
| TBT (Total Blocking Time) | Time when the page can’t be used because it’s still working |
| Desktop Metrics | Test result for people using a computer |
Bottom line:
Clear, simple reports would help everyone, not just developers.